An Introduction to Social Network Analysis
Social network analysis (SNA) is the methodical analysis of social networks. Social network analysis views social relationships in terms of network theory, consisting of nodes (representing individual actors within the network) and ties (which represent relationships between the individuals). These networks are often depicted in a social network diagram, where nodes are represented as points and ties are represented as lines.
 Example of a social network diagram
Relationships in a network can either be directional or nondirectional. In a directional relationship, one person is the initiator (or source of the relationship) while the other is the receiver (or destination of the relationship). For example, in the diagram above, node 1269 is the source while node 3777 is the destination. Relationships can also be described as dichotomous or valued. A dichotomous relationship is one where the only information that exists is whether or not a relationship exists between two people, where as in a valued relationship, a weight indicating the strength of the relationship is also available. To understand this better, let us look at the following data set from a fictional telecommunications company:

A social diagram representing one of the nodes (3777) in this data set is as follows:

In this diagram, the nodes are marked in dark colors while the weight of the relationship between two nodes are marked in light colors. Since all the relationships in this diagram have weights, all relationships are valued and none of them are dichotomous. Also, all these relationships appear to be directional with a clear source and a clear destination.
Two common metrics used to describe social networks are density and degree. Both these metrics represent connectivity but density focuses on the entire network or communities within the network where as degree focuses on the individuals within the network.
Network density
Density is represents the proportion of possible relationships in a network that are actually present. The value ranges from 0 to 1; the closer the value is to 0, the sparser the network is while the closer the value is to 1, the denser the network is.
The number of possible relationships in a network is calculated using the formula:
 where n = the number of nodes in the network and 2 is the maximum number of relationships possible between any two nodes in the network.
So for example, in a network containing 3 nodes, the maximum number of possible relationships is:
 Assuming there are 3 relationships in this network, the density is 3 / 6 or 0.5.
Similarly, in a network containing 5 nodes, the maximum number of possible relationships is:
 Assuming there are only 4 relationships in this network, the density is 4 / 20 = 0.2.
Therefore the first network is denser than the second network (since 0.5 > 0.2).
Nodal degree
Nodal degree is defined as the total number of relationships involving that node. Degree can be broken into two parts: indegree and outdegree. Indegree is the number of relationships in which a particular node is the target where outdegree is the number of relationships in which a particular node is the source.
The following table illustrates nodal degrees in a 7 node relationship:
 (Example sourced from SPSS SNA User Guide)
In the table above, A's degree measure is 3 split as indegree = 0 and outdegree = 3. This means that A is the source of 3 relationships in the network whereas B who has a degree measure of 1 (indegree = 1 and outdegree = 0) is the destination of 1 relationship in the network.
Indegree is often treated as a measure of prestige. Higher indegree values correspond to more relationships ending at that node. In other words, those individuals are contacted by a high number of other individuals. Many other nodes are initiating relationships with the node. Conversely, outdegree is treated as a measure of centrality. Higher values correspond to more relationships originating from that node. Those individuals contact a high number of other individuals. For the nodes in the example network, the degree values indicate that nodes A and D are the most active while nodes B and E are the least active. The indegree values reveal that node G has the most prestige. Based on the outdegree values, node A is the most central [Source: SPSS SNA User Guide].
Examining social networks using KXEN's Infinite Insight
KXEN's Infinite Insight has a highly advanced social network analysis module. Using the fictional call records data set indicated above, we can generate a social network diagram in just a few simple steps using Infinite Insight. Having generated the social network diagram, there are two ways to examine it:
* Top down
* Bottom up
Let us understand that top down approach first.
The top down view of the voice calls made during the month of May from the fictional data set is as follows:

This view shows us that there are a lot of relationships in the network and green circles represent super communities of users grouped together based on similar characteristics. The next level down appears as follows:

The diagram above displays a closer look at community # 10895 and its relationships with other communities in the network. You can drill down five levels in Infinite Insight all the way from the bird's eye view down to specific nodes in the network as shown below:

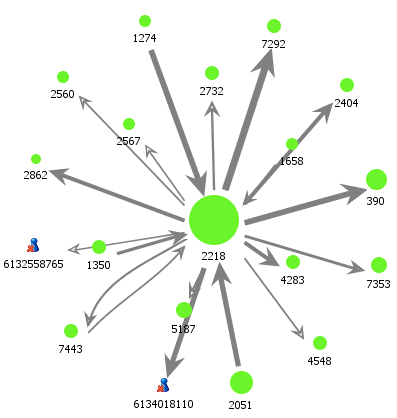
Infinite Insight also gives you the ability to adopt a bottom up approach and start at the node level and build up the social network. For example, we can start by examining node # 2218 and build the social network from the bottom up.
The visualization features within Infinite Insight give you the ability to color code variables of interest such as churn. Starting from the top down view, if you color code communities likely to churn in a specific color, you can then navigate down to specific nodes to understand exactly what is occurring and come up with action plans to reduce churn risk.
Applications of Social Network Analysis
Use cases for social network analysis are varied and include marketing as well as risk and fraud detection. Marketing applications include customer churn prediction and launching marketing campaigns. Since group characteristics can influence churn rates, you may be able to predict and prevent churn by using social network analysis to better understand group behavior and thereby individual behavior. Similarly by identifying influencers within groups, you can launch marketing campaigns. The influence of a group member make make other members more likely to purchase the offering. On the risk and fraud detection front, social network analysis can be used to detect money laundering and credit card fraud (using merchant-buyer patterns).
Relationships in a network can either be directional or nondirectional. In a directional relationship, one person is the initiator (or source of the relationship) while the other is the receiver (or destination of the relationship). For example, in the diagram above, node 1269 is the source while node 3777 is the destination. Relationships can also be described as dichotomous or valued. A dichotomous relationship is one where the only information that exists is whether or not a relationship exists between two people, where as in a valued relationship, a weight indicating the strength of the relationship is also available. To understand this better, let us look at the following data set from a fictional telecommunications company:
A social diagram representing one of the nodes (3777) in this data set is as follows:
In this diagram, the nodes are marked in dark colors while the weight of the relationship between two nodes are marked in light colors. Since all the relationships in this diagram have weights, all relationships are valued and none of them are dichotomous. Also, all these relationships appear to be directional with a clear source and a clear destination.
Two common metrics used to describe social networks are density and degree. Both these metrics represent connectivity but density focuses on the entire network or communities within the network where as degree focuses on the individuals within the network.
Network density
Density is represents the proportion of possible relationships in a network that are actually present. The value ranges from 0 to 1; the closer the value is to 0, the sparser the network is while the closer the value is to 1, the denser the network is.
The number of possible relationships in a network is calculated using the formula:
So for example, in a network containing 3 nodes, the maximum number of possible relationships is:
Similarly, in a network containing 5 nodes, the maximum number of possible relationships is:
Therefore the first network is denser than the second network (since 0.5 > 0.2).
Nodal degree
Nodal degree is defined as the total number of relationships involving that node. Degree can be broken into two parts: indegree and outdegree. Indegree is the number of relationships in which a particular node is the target where outdegree is the number of relationships in which a particular node is the source.
The following table illustrates nodal degrees in a 7 node relationship:
In the table above, A's degree measure is 3 split as indegree = 0 and outdegree = 3. This means that A is the source of 3 relationships in the network whereas B who has a degree measure of 1 (indegree = 1 and outdegree = 0) is the destination of 1 relationship in the network.
Indegree is often treated as a measure of prestige. Higher indegree values correspond to more relationships ending at that node. In other words, those individuals are contacted by a high number of other individuals. Many other nodes are initiating relationships with the node. Conversely, outdegree is treated as a measure of centrality. Higher values correspond to more relationships originating from that node. Those individuals contact a high number of other individuals. For the nodes in the example network, the degree values indicate that nodes A and D are the most active while nodes B and E are the least active. The indegree values reveal that node G has the most prestige. Based on the outdegree values, node A is the most central [Source: SPSS SNA User Guide].
Examining social networks using KXEN's Infinite Insight
KXEN's Infinite Insight has a highly advanced social network analysis module. Using the fictional call records data set indicated above, we can generate a social network diagram in just a few simple steps using Infinite Insight. Having generated the social network diagram, there are two ways to examine it:
* Top down
* Bottom up
Let us understand that top down approach first.
The top down view of the voice calls made during the month of May from the fictional data set is as follows:
This view shows us that there are a lot of relationships in the network and green circles represent super communities of users grouped together based on similar characteristics. The next level down appears as follows:
The diagram above displays a closer look at community # 10895 and its relationships with other communities in the network. You can drill down five levels in Infinite Insight all the way from the bird's eye view down to specific nodes in the network as shown below:
Infinite Insight also gives you the ability to adopt a bottom up approach and start at the node level and build up the social network. For example, we can start by examining node # 2218 and build the social network from the bottom up.
The visualization features within Infinite Insight give you the ability to color code variables of interest such as churn. Starting from the top down view, if you color code communities likely to churn in a specific color, you can then navigate down to specific nodes to understand exactly what is occurring and come up with action plans to reduce churn risk.
Applications of Social Network Analysis
Use cases for social network analysis are varied and include marketing as well as risk and fraud detection. Marketing applications include customer churn prediction and launching marketing campaigns. Since group characteristics can influence churn rates, you may be able to predict and prevent churn by using social network analysis to better understand group behavior and thereby individual behavior. Similarly by identifying influencers within groups, you can launch marketing campaigns. The influence of a group member make make other members more likely to purchase the offering. On the risk and fraud detection front, social network analysis can be used to detect money laundering and credit card fraud (using merchant-buyer patterns).


Another key application: Early warning systems to control epidemics.
ReplyDeleteEpidemics control is a very interesting application, although not necessarily "social" in the true sense of a "social network". Obtaining the data to do this sort of analysis may be a challenge so for early warning, we may need to use existing social networks of people infected early. In most cases, that would be family, work colleagues and then friends. Challenging to do this at a macro scale - but will be phenomenal if someone can do this. If you know of someone doing this, please let me know - I would really like to know how.
DeleteSocial network analysis (SNA) is the methodical analysis of social networks. Social network analysis views social relationships in terms of network theory, consisting of nodes (representing individual actors within the network) what is a social network
ReplyDeleteHere you go: http://en.wikipedia.org/wiki/Social_network
DeleteThanks for sharing this article. Data have become more important than ever, everywhere! Data in Gaming Industry plays a major role in a platform's success. That being said, What do you think about its role in the gaming industry?
ReplyDeleteI think marketing automation software's will help reduce churn rate like never before. Can it be deployed like this article?
Customer Churn