Posts

Showing posts from August, 2017

Engine bleed air: a primer

Image
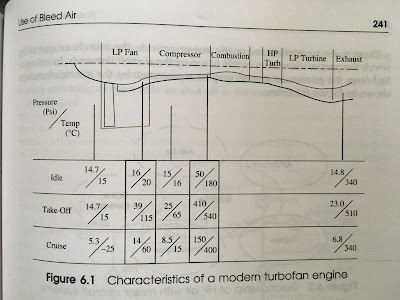
Use of Bleed Air in Aircraft Pneumatic Systems: A Primer ( taken from Chapter 6 on Pneumatic Systems from the 3 rd Edition of the book “Aircraft Systems” by Ian Moir and Allan Seabridge ) The use of aircraft engines as a source of high pressure, high temperature air can be understood by examining the characteristics of the turbofan engine.   Modern engines “bypass” a significant portion of the mass flow past the engine and increasingly a small portion of the mass flow passes through the engine core or gas generation section.   The ratio of bypass air to engine core air is called the bypass ratio and this can easily exceed 10:1 for the very latest civil engines; much higher than the 4 or 5:1 ratio for the previous generation. The characteristics of a modern turbofan engine are shown in figure 6.1.   This shows the pressure (in psi) and the temperature (in degree centigrade) at various points throughout the engine for three conditions: ground idle, take off power and

Data Preparation in R

My latest publicly available R notebook created in IBM's Data Science Experience is here !  This notebook focuses on the basics of one of the most important aspects of Data Science: Data Preparation! I hope you enjoy this notebook .  Please feel free to share and let me know your thoughts. My latest #R #notebook : Data Preparation in R https://t.co/5yXpG5DHFY #DataScience #dsx #ibmaot #IBM h/t @kabacoff pic.twitter.com/42j6hMRFaF — Venky Rao (@VRaoRao) August 24, 2017

Getting started with graphs in R

My next publicly available R notebook created in IBM's Data Science Experience is here !  This notebook helps users get started with basic graphs in R and contains general techniques that apply to all graphs in R except those created using the "ggplot2" library. While only a few lines of code are needed to create graphs in R, I have provided extensive comments for each line of code so first-time R-users can also follow along.  I hope you enjoy this notebook.  Please feel free to share and let me know your thoughts. My latest #R #notebook : Basics of #graphs in #rstats https://t.co/2CU6uGJGOF #DataScience #dataviz #dsx #ibmaot #IBM h/t @kabacoff pic.twitter.com/HdCCRxP8FG — Venky Rao (@VRaoRao) August 21, 2017

Data Structures in R

In order to help users to get started with IBM's Data Science Experience , I have started developing tutorials / cookbooks.  My preferred language for Data Science is R so all my Jupyter notebooks will use that language. My very first tutorial is on Data Structures in R.  I recently acquired the second edition of Dr. Robert Kabacoff's excellent book titled "R In Action" and have decided to create a Jupyter notebook for (almost) every chapter in the book.  Here is the first one.  I hope you enjoy it.  Please feel free to comment and let me know your thoughts. Click on this link for a quick tutorial on #Data Structures in #R : https://t.co/EsalloitG5 #rstats #ibm #dsx #ibmaot hat tip to @kabacoff pic.twitter.com/m9kDINC9CX — Venky Rao (@VRaoRao) August 11, 2017

SPSS Modeler - R Integration

Image